

Executive Summary
Risk is the currency which pays investors a return. The type, and amount, of risk exposure that an investor chooses to take on is one of the greatest determinants of portfolio performance and outcome. This rule of thumb is also inherently true for providers of discretionary solutions, though to a slightly different degree. In discretionary portfolio management, once an investment policy index is determined, it is active risk (tracking error) which plays a large role in determining portfolio outcomes and success relative to that policy. Active risk is generated any time that a portfolio exposure is different from the policy benchmark and therefore leads the portfolio to perform differently from the policy benchmark. Active risk includes: traditional active management, long-term portfolio structure decisions such as beta bets (specific positions in equity, credit, rates, or other market betas) and style bets (value or growth, small-cap, etc.) that are different from the policy benchmark, tactical tilts meant to take advantage of short-term market opportunities, and portfolio rebalancing approaches. But active risk is also often generated on accident, through benchmark mismatches between a policy index benchmark and the benchmark an active manager is focused on, for example. As a provider of discretionary portfolio management, we believe much of our role is to thoughtfully take on active risk in areas that offer the most attractive risk-adjusted payoffs for our clients, with a preference for consistency of outcomes.
What are the sources of active risk?
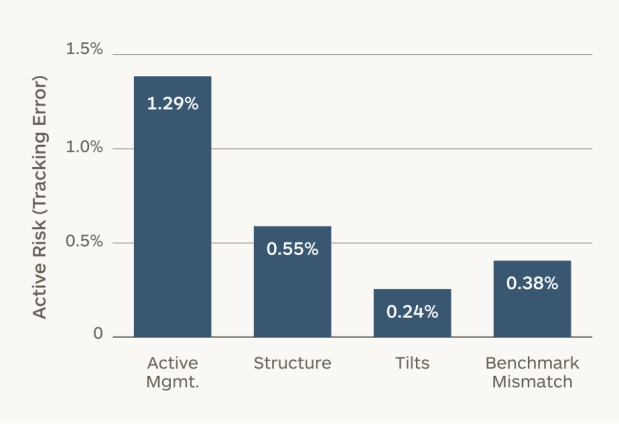
Active risk is potentially generated from four sources in any portfolio. Below we briefly outline each of those sources and preview a quantitative tool that Cerity Partners Institutional Consulting uses with clients to understand how each source is contributing to total portfolio active risk.
Active Management: Traditional active management risk is perhaps the first risk that comes to mind on the topic of active risk. Active management risk is generated from active strategies and the decisions taken in attempts to outperform the strategy benchmark, such as through stock selection.
Structure: Longer-term “structure” decisions — specific and intentional over- or underweight positions in equity, credit, rates, or other market betas and style bets — that are different from the policy benchmark contribute to active risk. These decisions may be arrived at due to differences in an investor’s long-term capital market assumptions, if certain asset classes are believed to offer especially attractive or unattractive prospects for the future.
Tilts: Shorter-term tilt decisions may be pursued if an investor sees a specific opportunity or threat which they wish to capitalize on by shifting portfolio exposures over the short- or medium-term.
Benchmark Mismatch: However, most investors are also experiencing active risk from a source which is not expected to add any return to the portfolio. This comes in the form of ‘benchmark mismatch’. Benchmark mismatch occurs when the benchmarks of exposures in the portfolio are different than benchmarks in the investment policy index — most commonly the benchmarks of active managers. In the same way that active manager holdings that are different from a benchmark create active risk for the investor, benchmarks that are different from policy index benchmarks generate active risk, often material in size.
On an ongoing basis, many investors discuss and quantify one, or a few, of these active risk sources in their portfolio, but most tools are unable to provide a holistic look at all sources. Cerity Partners Institutional Consulting has developed such a tool, as shown below, which allows an investor to understand the active bets they are taking and the areas where those bets are larger or smaller.
MEASURING THE SOURCES OF PORTFOLIO ACTIVE RISK
What type of active risk is preferred?
Our answer here is likely in line with what the reader of this paper would expect — we prefer taking positions that offer the most attractive risk-adjusted returns with consistent payoff. For ‘active management’ decisions, we more heavily emphasize active management across asset classes where active managers have shown a consistent ability to outperform their benchmarks, such as emerging market equities or active global equity. Greater holdings concentration and high active share are preferred attributes across many asset classes. For ‘structure’ decisions, we often prioritize risk premia that tend to deliver attractive risk-adjusted returns in a consistent manner, such as investment grade credit, which tends to overcompensate investors for both the credit default risk of the asset class as well as spread volatility. For decision-making around shorter-term ’tilts’, we take into account our conviction level, the likelihood of success given historical relative performance of each exposure, and the size of the potential payoff on a risk-adjusted basis. Lastly, ‘benchmark mismatch’ is a source of active risk with typically no expected compensation, and therefore should be eliminated wherever possible.
The market environment can of course also play a role in determining the relative attractiveness of each active risk source — for example, rich asset pricing and mild risk premia in a generally strong economic environment, with positive market momentum, might leave investors content with sticking fairly close to their policy index and taking fewer active tilts. On the other hand, an environment of cheaper assets, higher risk premia, and market dislocations may lead investors to take greater active ‘tilts’, to lean into higher risk premia on a portfolio ‘structure’ basis, and to deploy traditional ‘active management’ to a greater degree.
Risk budgeting as a component of fund governance
Investor beliefs also play an important role in determining risk budgeting and the types of active risk to pursue. Reasonable investors may strongly disagree on topics such as fees — some of the opinion that markets are generally efficient and that ultralow management fee funds are preferred across most asset classes, and some of the opinion that highly skilled management and large alpha opportunities are available for investors who do the work and can gain access, and that this alpha comes with higher management fees. Differences of opinion exist in other areas as well, such as in the willingness to try and profit from shorter-term market dislocations and the ability of investors to benefit from short-or medium-term market tilts over time.
These types of investor beliefs are an essential input for a discretionary solutions provider in determining which active return sources should play a greater or lesser role in the portfolio management process. Beliefs and preferences are translated into portfolio structure in the form of bounds or goalposts around active risk targets. Do we believe an optimal balance of active risk exists? At Cerity Partners Institutional Consulting, we generally target an active risk budget that includes: 70% of active risk fueled by active management, 20% of active risk fueled by structure decisions, and 10% of active risk fueled by tilt decisions. But this is likely one of those investment topics that is both art and science, with no single perfect answer. We believe the decision should be influenced and adjusted based on the beliefs and preferences of each investor and their own objectives.
Conclusion
The type, and amount, of risk exposure that an investor chooses to take on is one of the greatest determinants of portfolio performance and outcome. For a discretionary solutions provider, it is active risk which plays a large role in driving portfolio outcomes and success. Active risk is generated any time that a portfolio exposure is different from the policy benchmark, and includes: traditional active management, long-term portfolio structure decisions such as beta bets (specific positions in equity, credit, rates, or other market betas) and style bets (value or growth, small-cap, etc.), tactical tilts meant to take advantage of short-term market opportunities, and portfolio rebalancing approaches. The amount of emphasis placed on each of these sources of active risk is a decision that should be guided by each investor, their preferences, and their objectives. We prefer taking active risk positions that offer the most attractive risk-adjusted returns with consistent payoff. While active risk budgeting should be tailored to the beliefs and preferences of each investor, as a starting point we generally target an active risk budget that includes: 70% of active risk fueled by active management, 20% of active risk fueled by structure decisions, and 10% of active risk fueled by tilt decisions. Active risk that is uncompensated, such as that which is a product of benchmark mismatch, should be mitigated as much as possible. For more information regarding our views on active risk in discretionary portfolio management, please reach out to your Cerity Partners consultants.
Information and data are as of the date herein and have not been updated to reflect subsequent market conditions.
Cerity Partners Retirement Plan Advisors LLC d/b/a Cerity Partners Retirement Plan Consultants and Cerity Partners Institutional Consulting (“RPC”, “CPIC”, “we,” “us” or “the Adviser”) is registered with the U.S. Securities and Exchange Commission as an investment adviser and is a wholly-owned subsidiary of Cerity Partners LLC. Registration as an investment adviser does not imply any level of skill or training.
The information contained herein is not personalized investment, tax, or legal advice and is for informational purposes only. There is no guarantee that any views or opinions expressed will come to pass. This information is subject to change without notice and should not be considered an offer to sell or a solicitation to buy any security. Past performance is not indicative of future results. Before making any decision that may affect your retirement plan or finances, consult a qualified professional adviser.
For information about the Adviser’s registration status, refer to the Investment Adviser Public Disclosure website at www.adviserinfo.sec.gov. For additional information about the Adviser’s services, fees, conflicts of interest, and related persons, please request our Form ADV Part 2A and Form CRS disclosure documents. Please read these documents carefully before engaging our services. © 2026 Cerity Partners Retirement Plan Advisors LLC. All rights reserved.
Please read important disclosures here.